Operative Systemübersicht
Standorte, Cluster und Geräte werden zentral visualisiert und bleiben auch über Portfolios hinweg strukturiert navigierbar.
Die Plattform verbindet Anlagenübersicht, Live-Werte, detaillierte Datenauswertung, Reporting, Firmenstrukturen und erweiterte Module wie Simulation oder E-Mobility-Backend in einer browserbasierten Oberfläche.
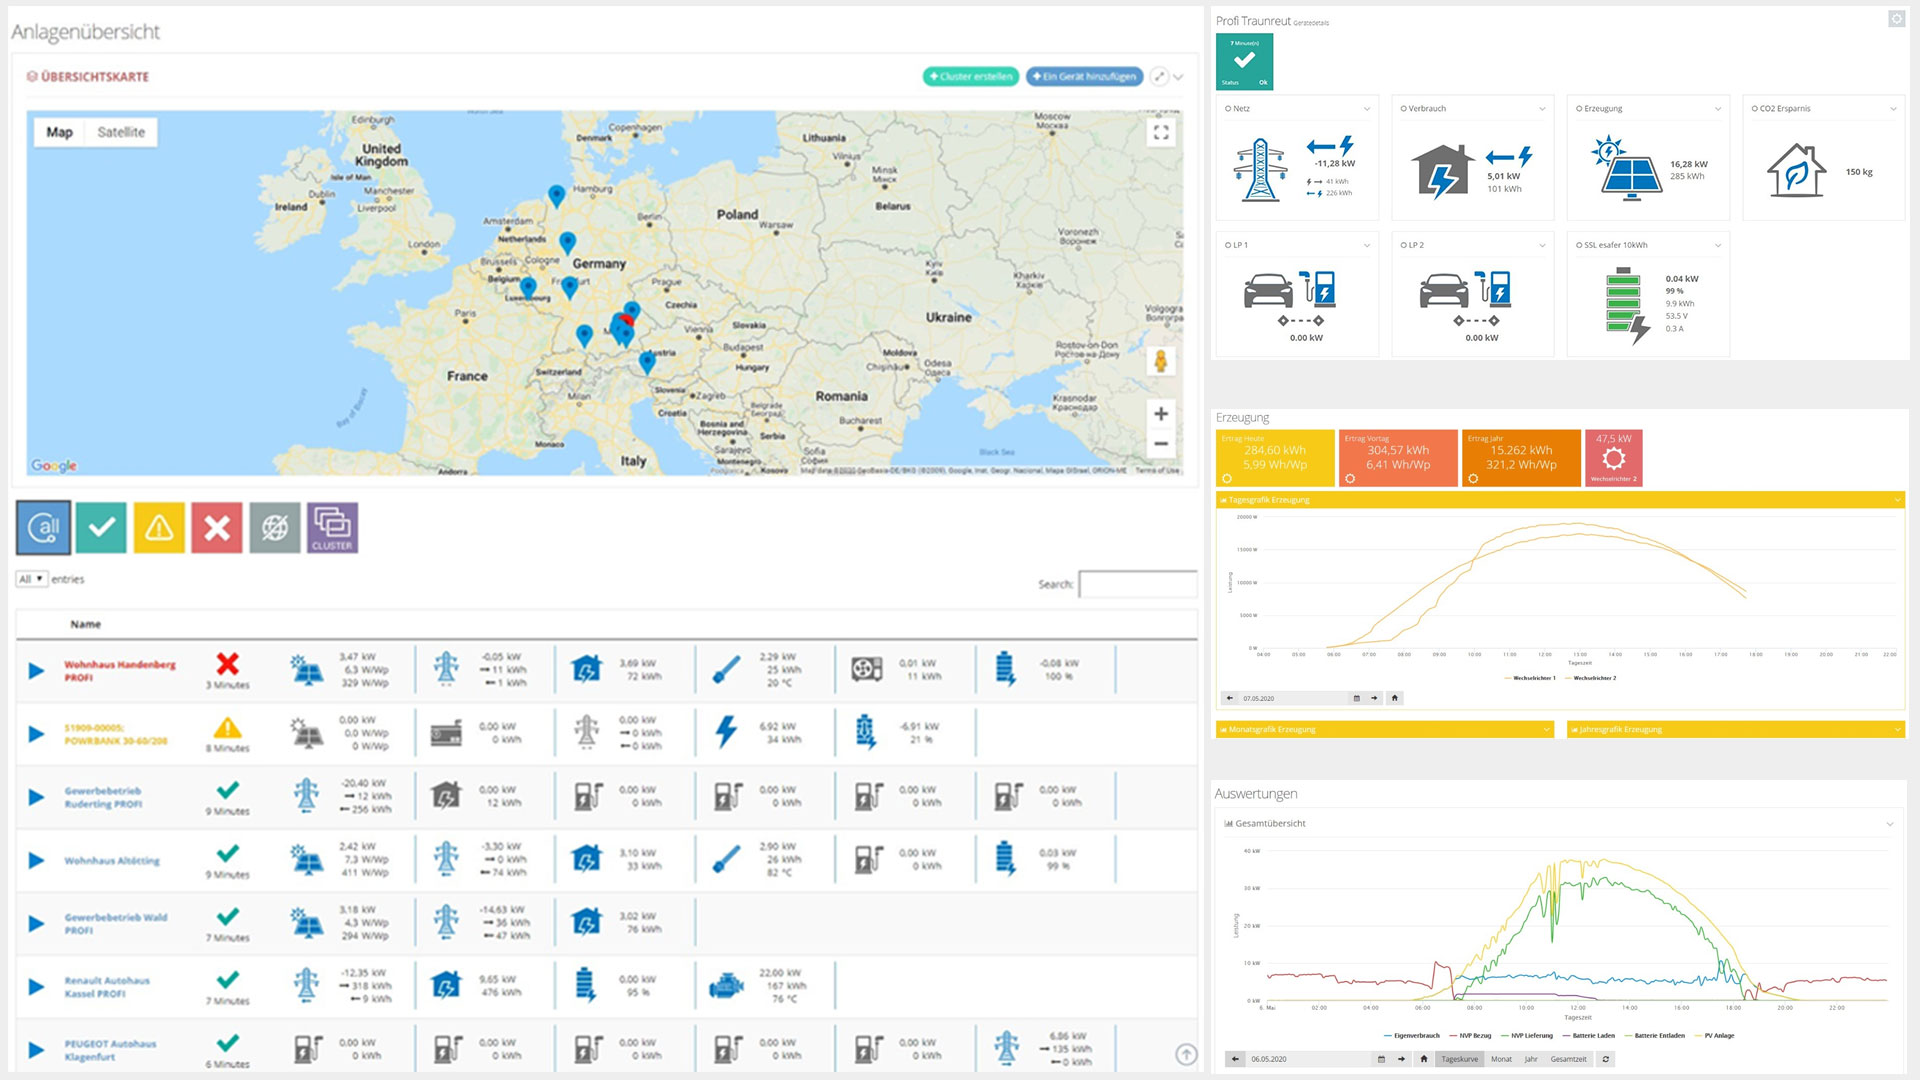
Standorte, Cluster und Geräte mit aktuellen Zuständen und Zuweisungen.
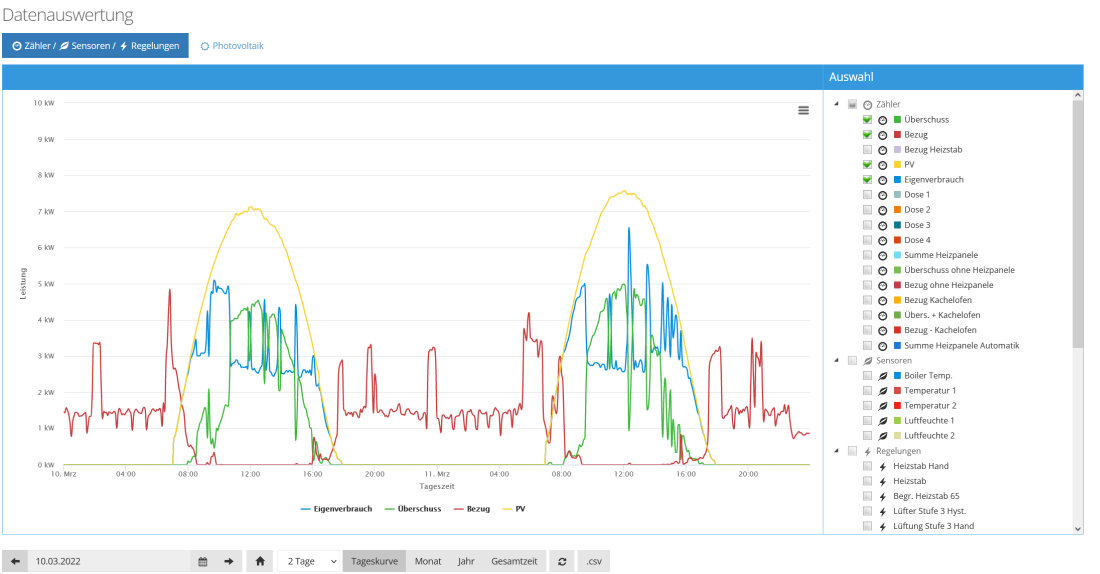
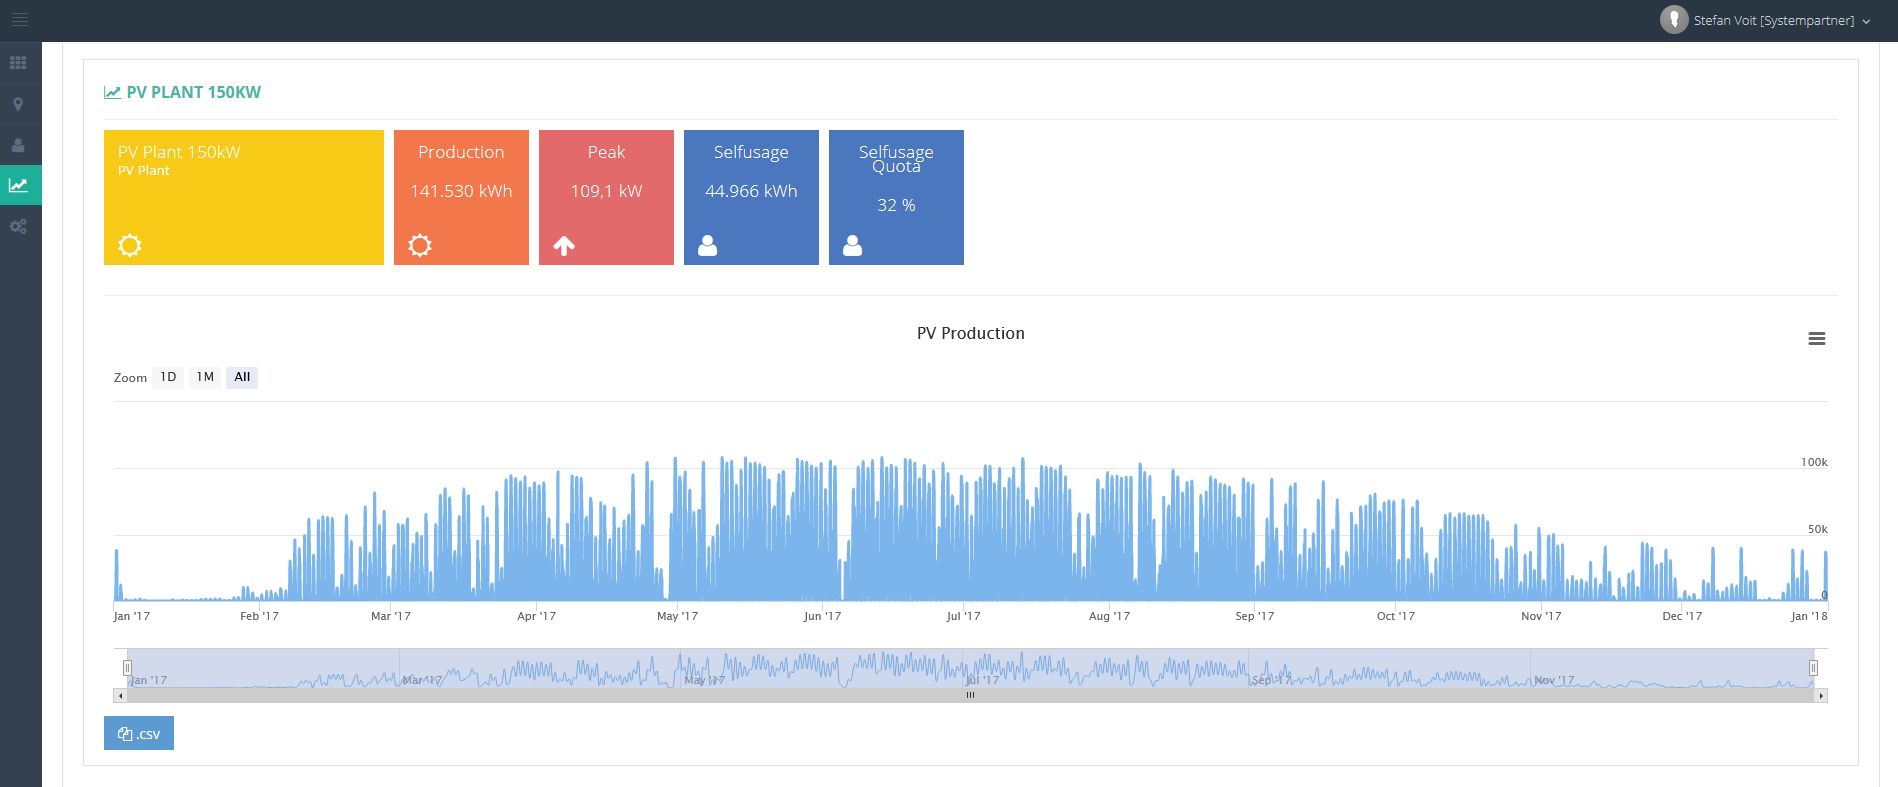
KPIs, Lastprofile, PV-Analyse, Exporte und technische Vergleichsansichten.
Simulation, Reporting, Firmenstrukturen und E-Mobility-Abläufe.
Bereits die erste Ansicht soll zeigen, wie Betriebsdaten, technischer Kontext und Organisation in einem EMS-Arbeitsraum zusammenkommen.
Standorte, Cluster und Geräte werden zentral visualisiert und bleiben auch über Portfolios hinweg strukturiert navigierbar.
Live-Werte, Detailauswertung, PV-Ansichten, Lastprofile und Zusatzcharts stehen direkt aus dem Betriebskontext bereit.
Statusauswertung, Filter, Exporte und Berichte unterstützen Teams bei Dokumentation und schneller Bearbeitung.
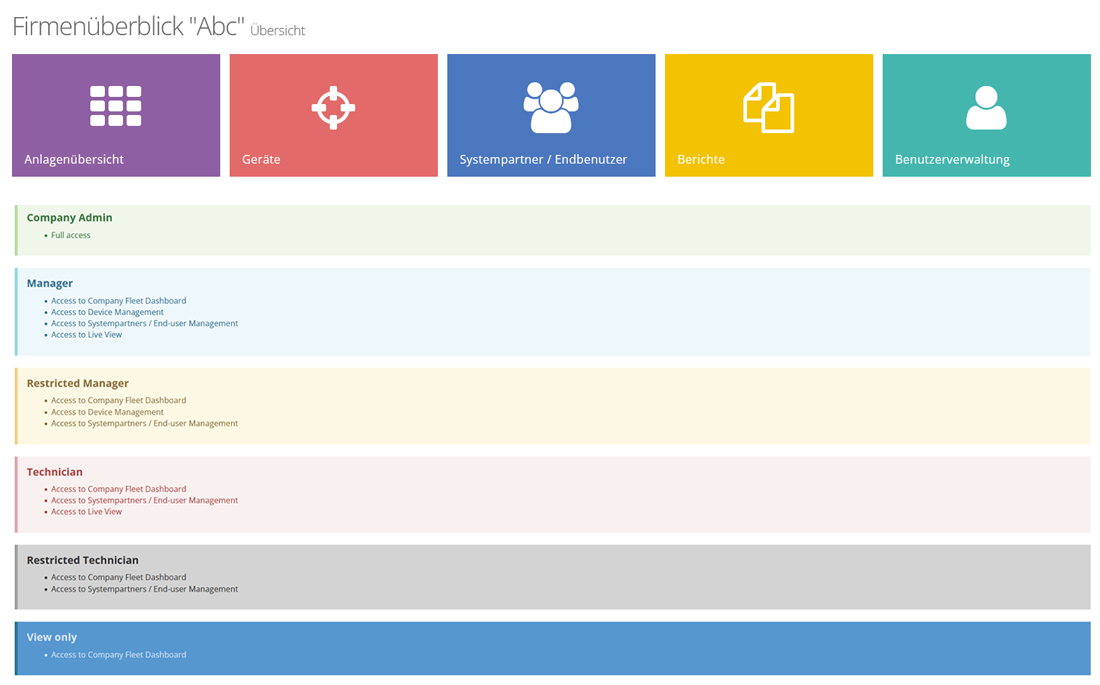
Kunden, Systempartner, Endnutzer und Firmenrollen lassen sich transparent in einem gemeinsamen Portal verwalten.
Eingehende Felddaten werden nicht nur gespeichert, sondern strukturiert, verglichen und in technische Handlungsschritte übersetzt.
Geräte, Zähler, Sensoren, Regelpunkte, Standorte und Zuordnungen werden zentral konsolidiert.
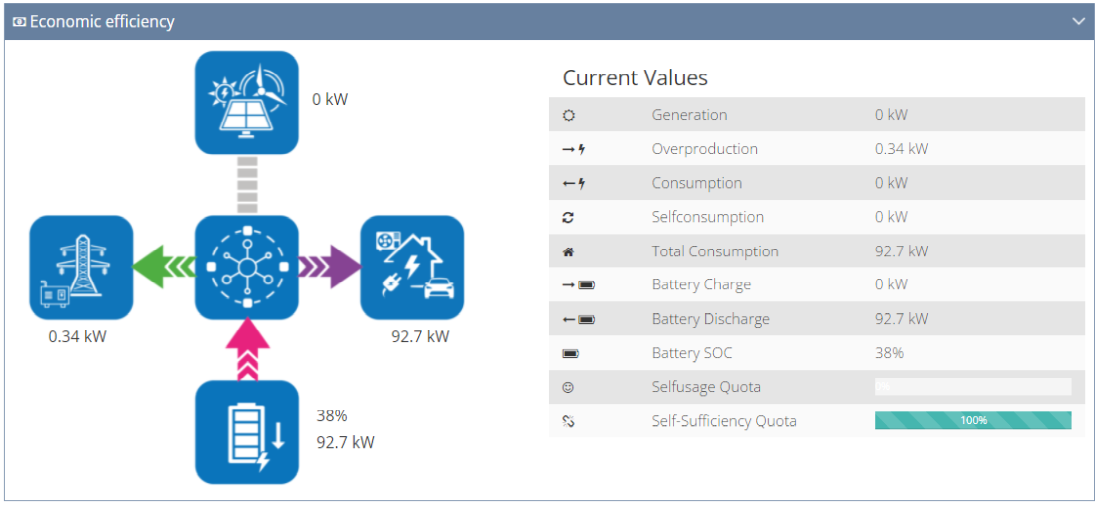
Statusansichten, KPIs, Lastprofile, Photovoltaik-Analyse, Wirtschaftlichkeit und Mehrfachskalierung machen Zusammenhänge sichtbar.
Teams analysieren Ereignisse, exportieren Berichte, verwalten Zugriffe und setzen den operativen Ablauf direkt im Portal fort.
Das EMS-Portal verbindet Live-Zugriff, Analyse, Reporting und Organisation in einem technischen Arbeitsbereich.
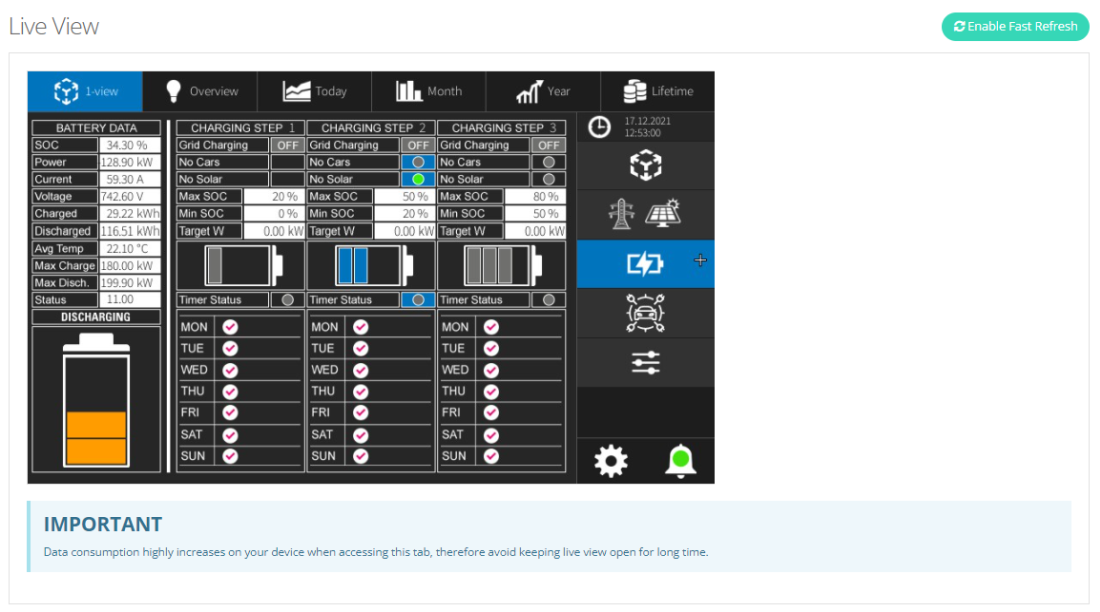
Von der Übersichtskarte bis zur Live-Ansicht zeigt das Portal den aktuellen Betriebszustand ohne Systemwechsel.
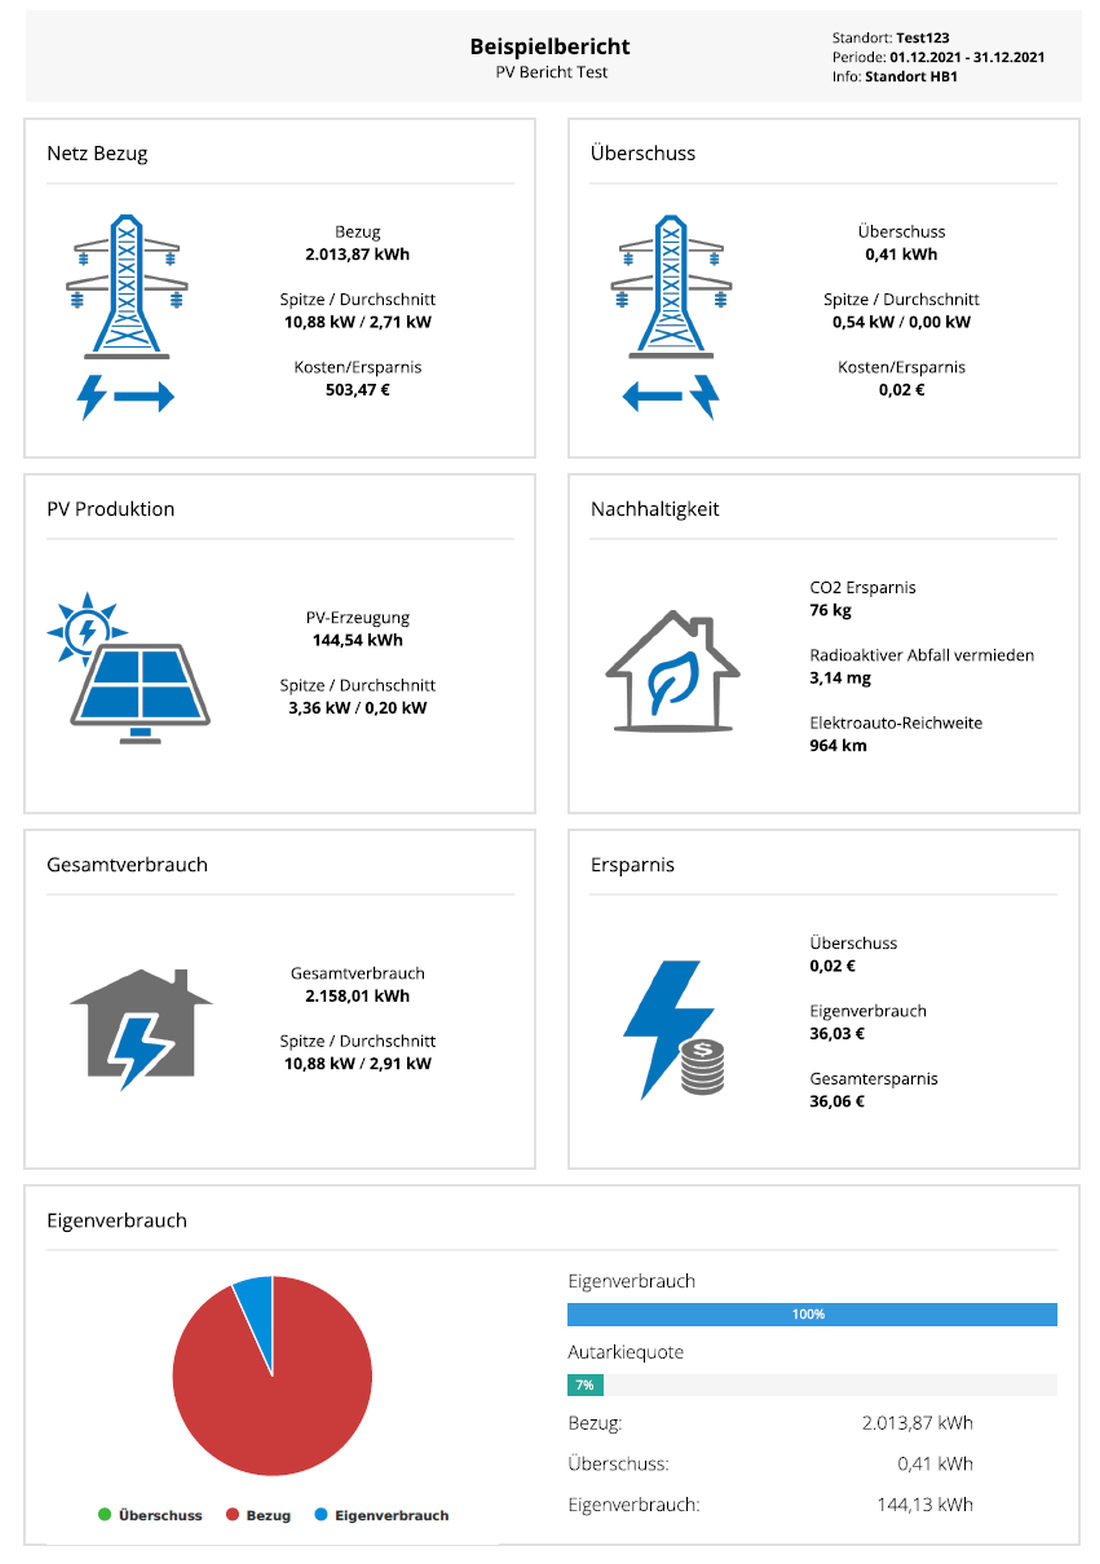
Technische Analyseansichten und strukturiertes Reporting laufen in einem durchgängigen Arbeitsablauf zusammen.

Auch bei wachsenden Portfolios, Kundenstrukturen und Serviceorganisationen bleiben Zuständigkeiten nachvollziehbar.
Spezialisierte Portalmodule können dort ergänzt werden, wo tiefere technische oder operative Abläufe benötigt werden.
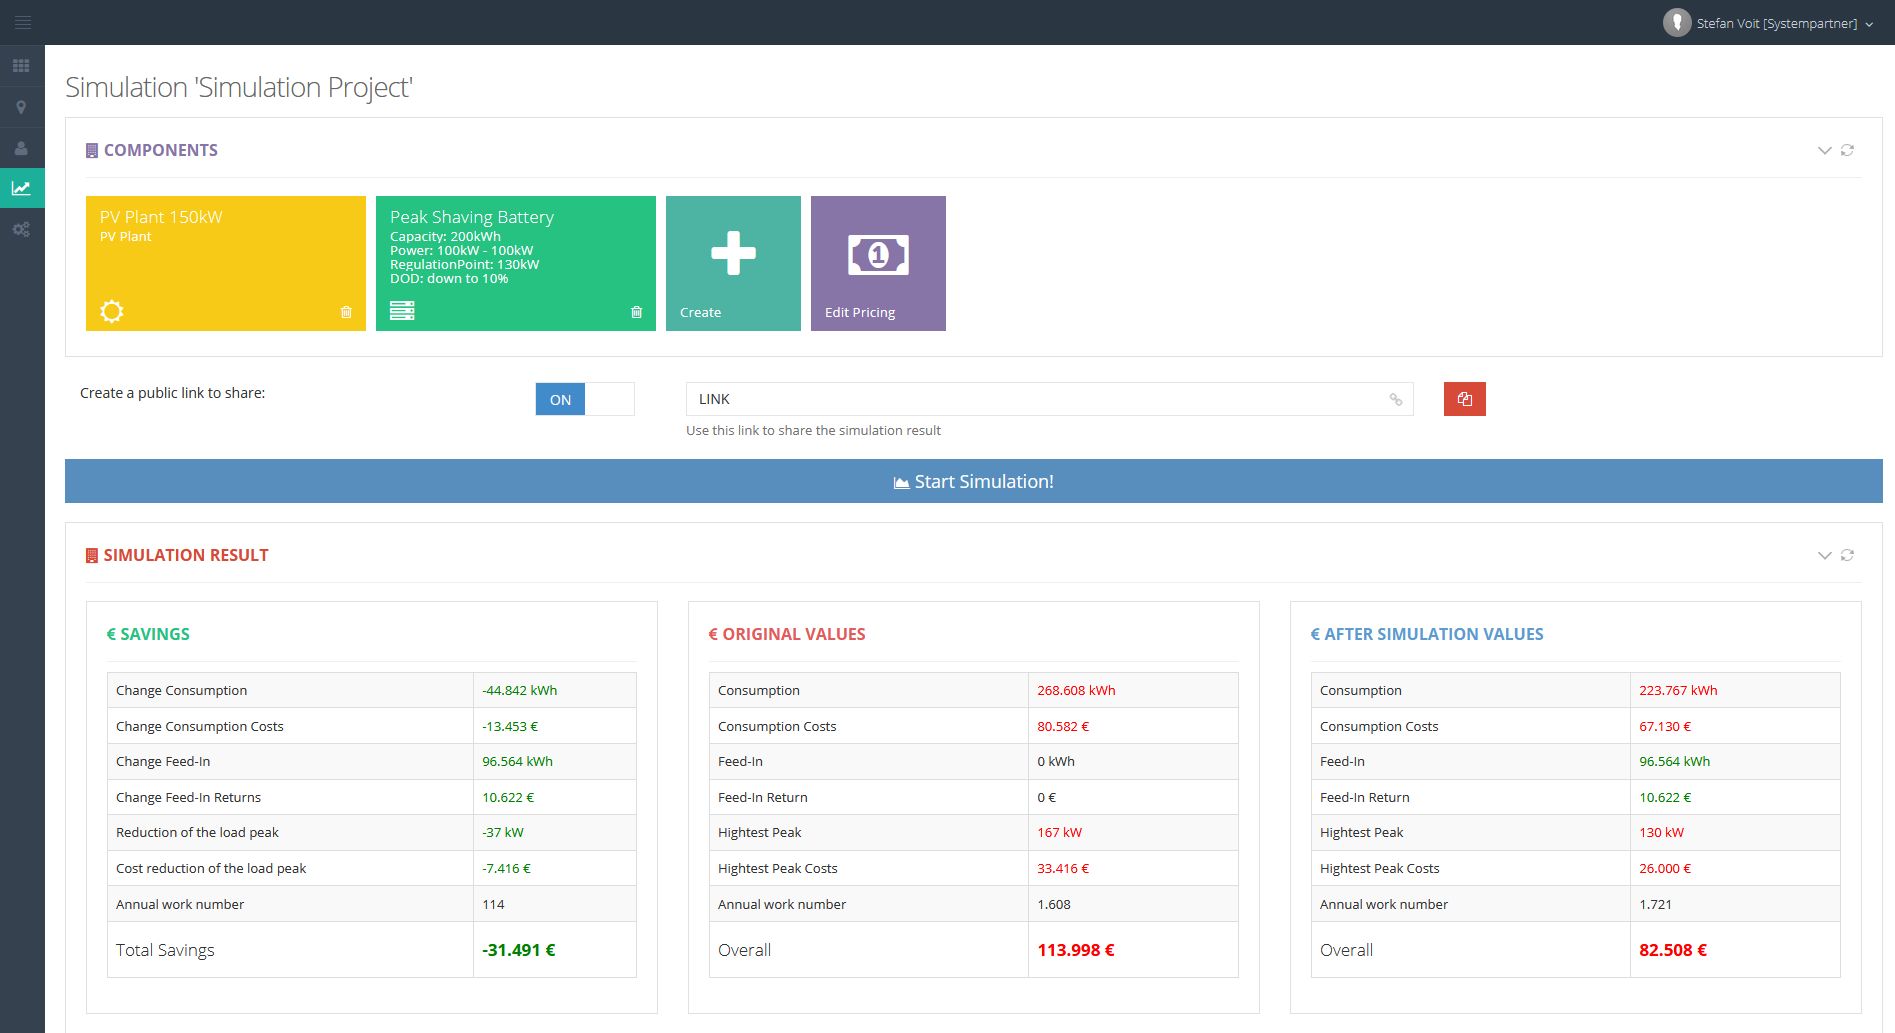
Der Simulator vergleicht technische Auslegung und wirtschaftliche Wirkung vor der Umsetzung auf Basis realer Lastprofile und Historiendaten.
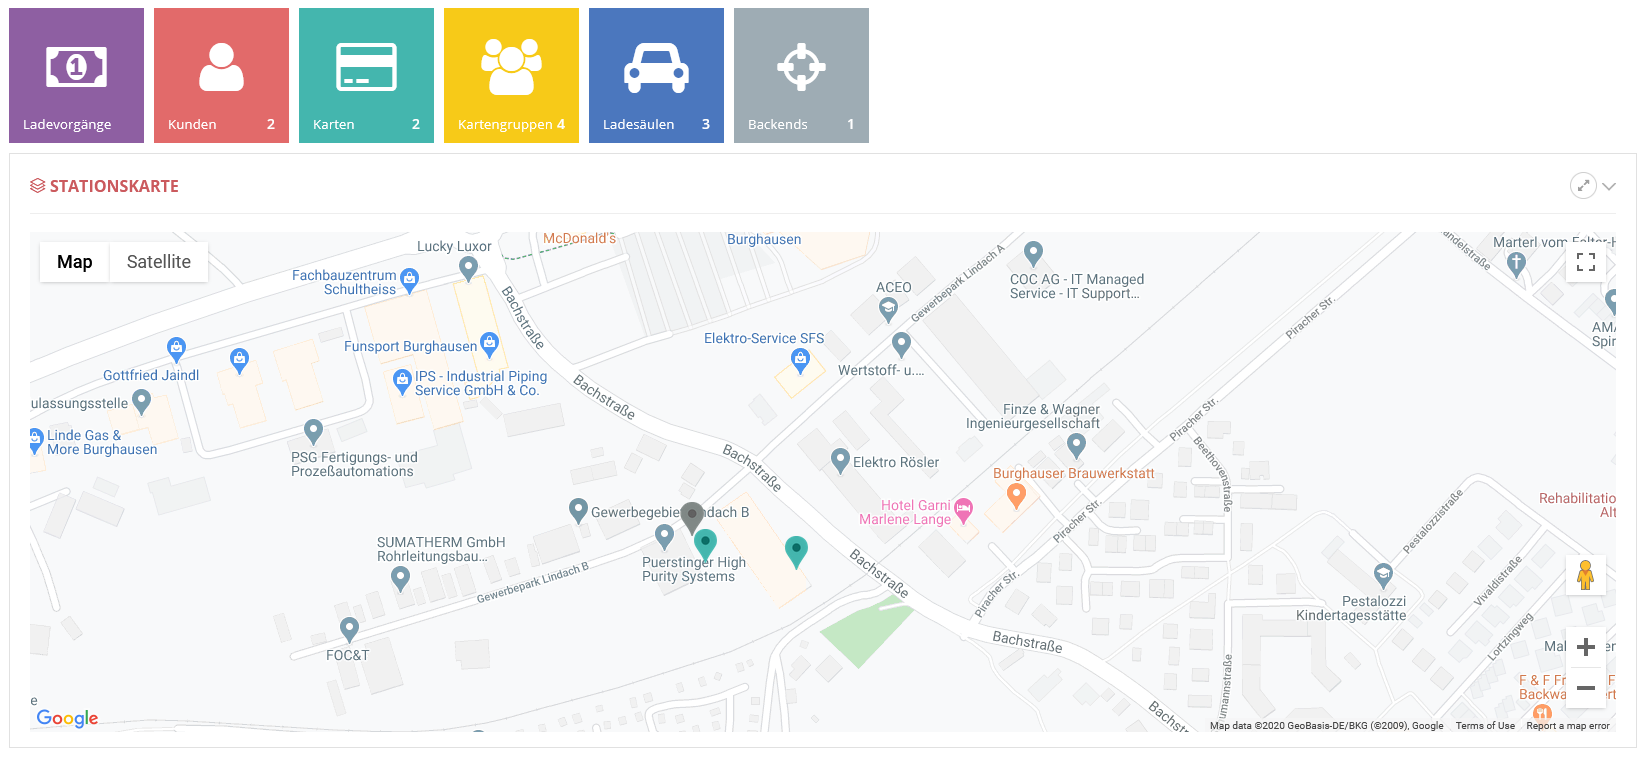
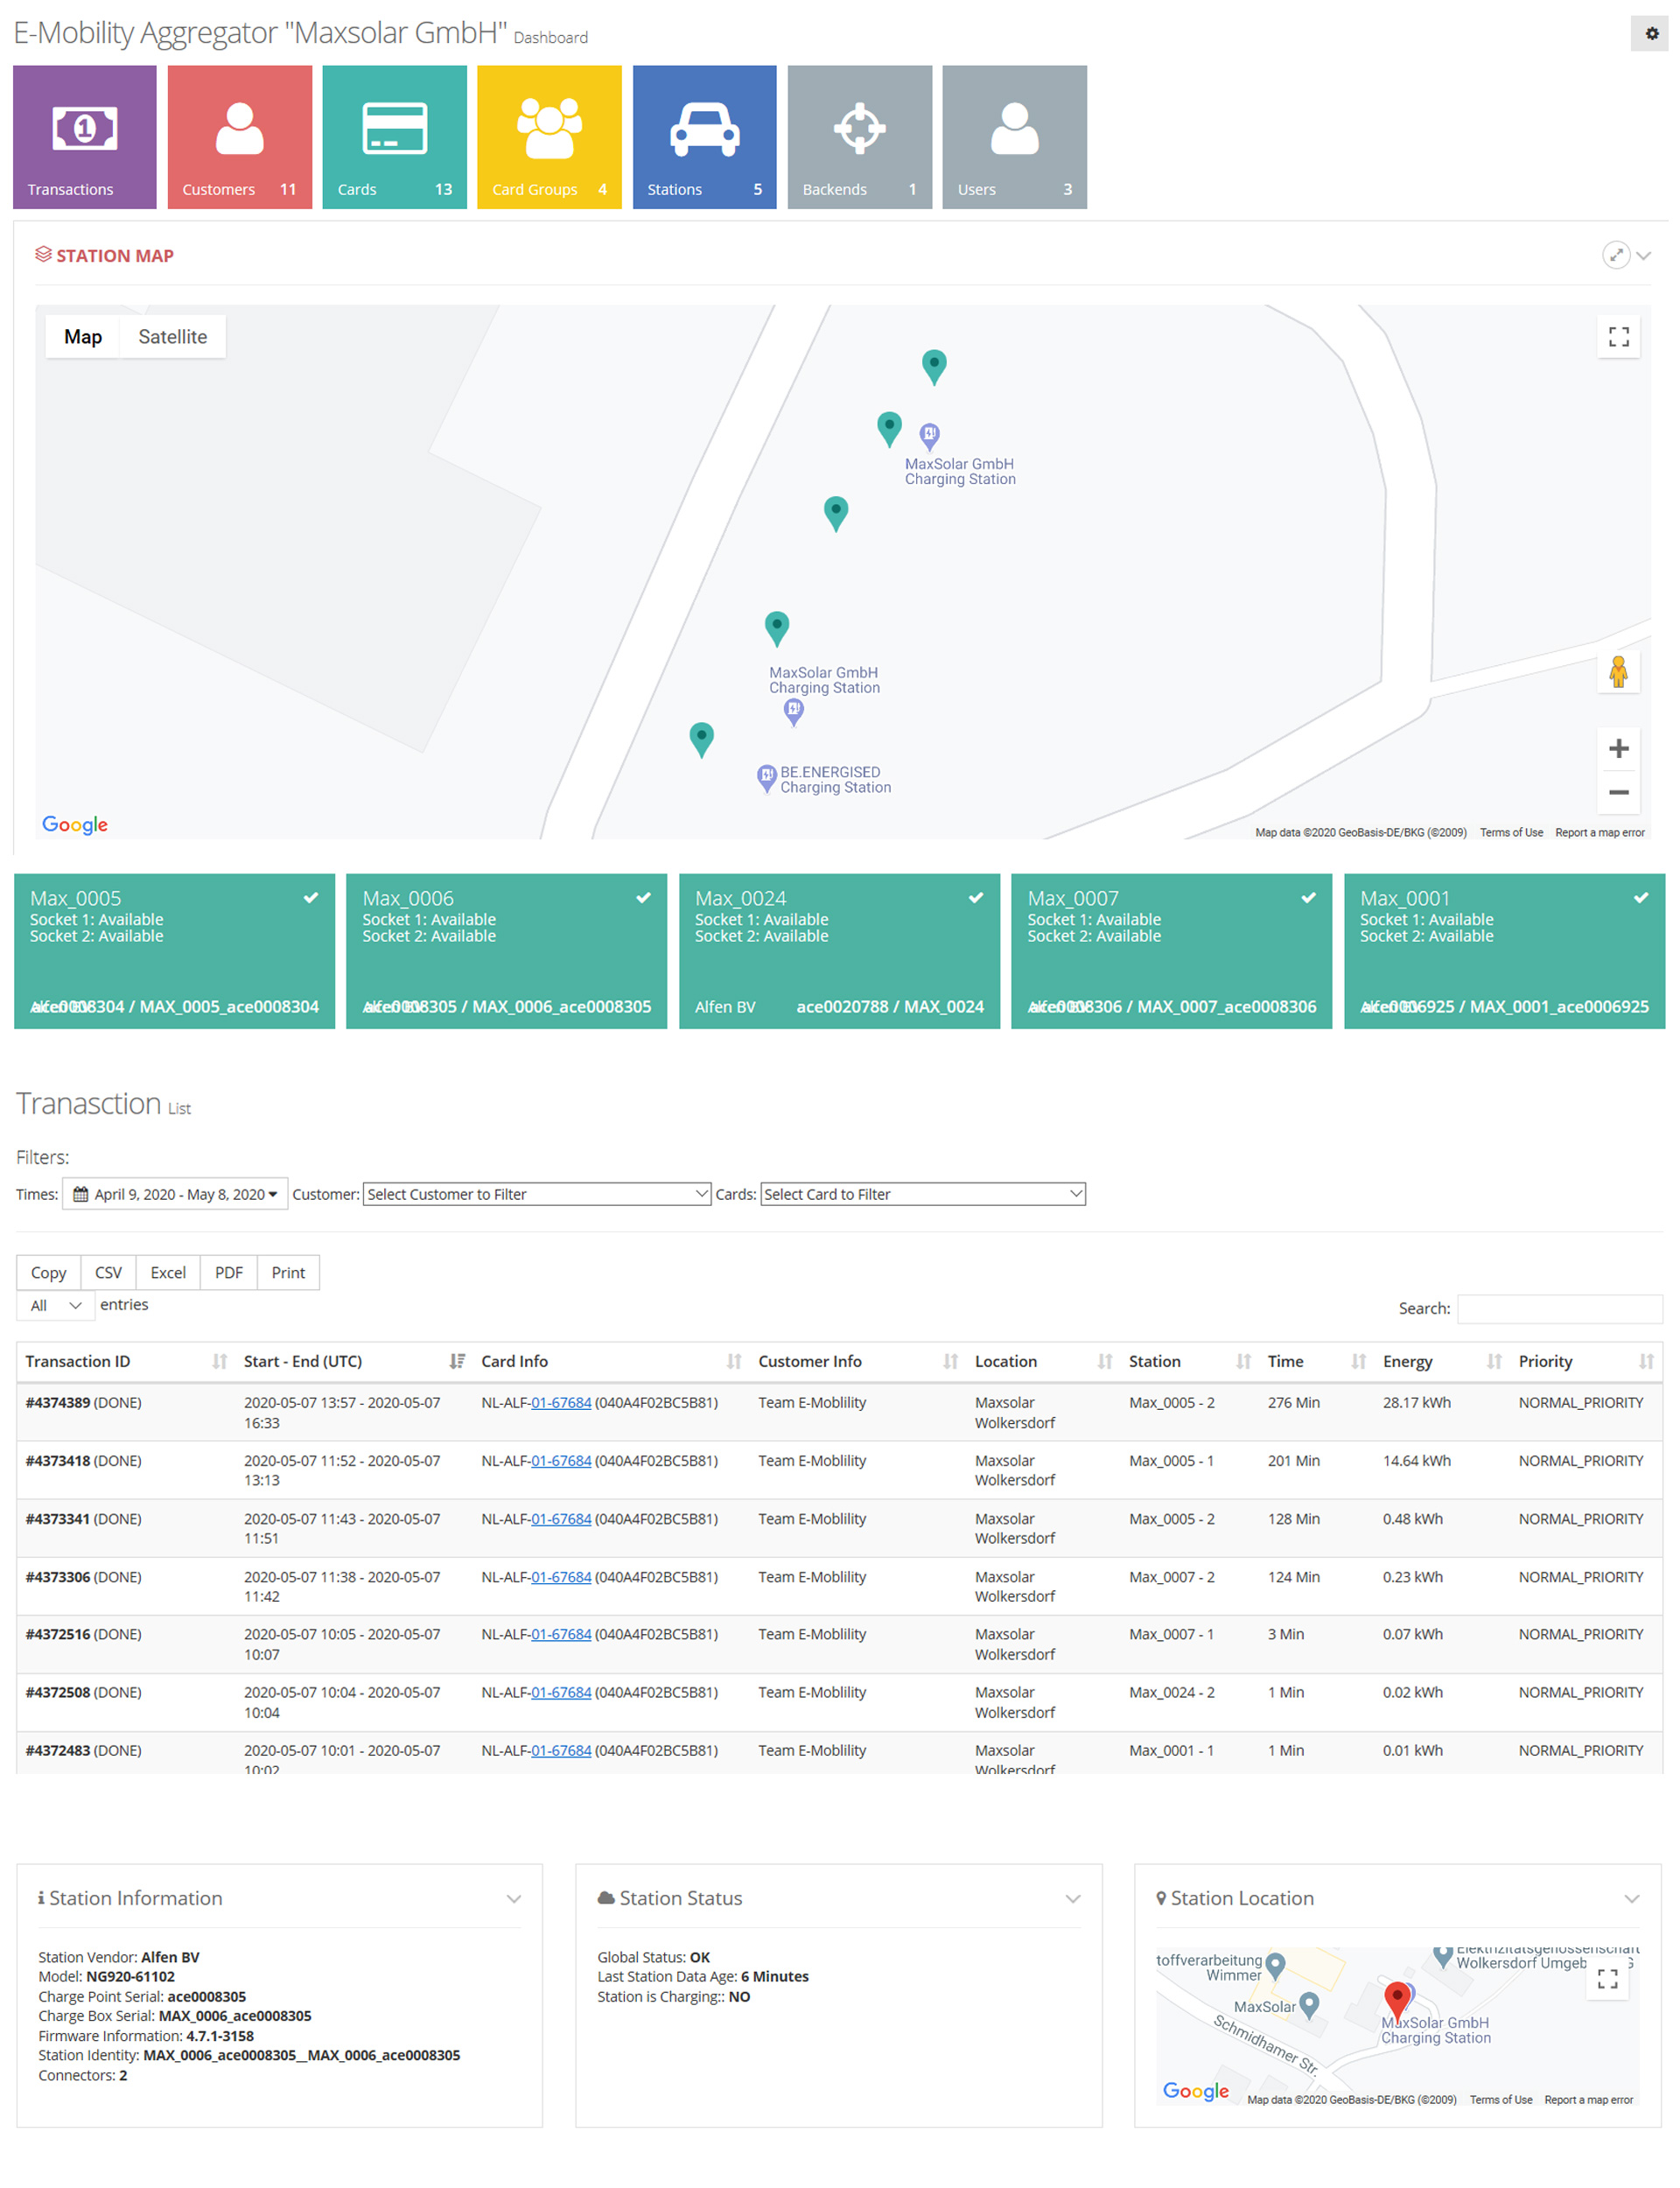
Das Backend verwaltet Stationen, Karten, Benutzer und Ladevorgänge und unterstützt Priorisierung sowie exportbasierte Abrechnungsabläufe.
Überwachen Sie Energieperformance, Betriebszustände und Abweichungen über einzelne Anlagen oder ganze Portfolios.
Erkennen Sie Auffälligkeiten früher, analysieren Sie Statusmeldungen und bearbeiten Sie technische Befunde im passenden Kontext.
Verwalten Sie Kunden, Standorte, Reporting-Strukturen und Rollenmodelle über wachsende Organisationslandschaften hinweg.
Bestehende Benutzer können sich direkt anmelden. Neue Benutzer starten über die Registrierung und arbeiten anschließend mit Monitoring, Reporting, Analyse und organisatorischen Funktionen in einem technischen Portal.